
IB Phillips Curve
Your ultimate resource for mastering the Phillips Curve in IB Economics - from fundamental trade-offs to modern policy challenges
The Phillips Curve reveals the complex relationship between unemployment and inflation, yet most students struggle to move beyond the basic inverse relationship. This comprehensive hub covers every aspect of the Phillips Curve you'll encounter in your IB Economics course, from original theory and stagflation breakdown to cutting-edge monetary policy debates and expectation-augmented models.
What You'll Master:
Complete Phillips Curve theory and trade-off fundamentals
Real-world examples across different economies and time periods
Current monetary policy debates and central bank case studies
Exam techniques and evaluation frameworks for your IB Economics course
Links between Phillips Curve and other key IB economics topics
Full breakdowns of diagrams and evaluation tools are available exclusively in the IB Economics course.


Fundamental Theory & Concepts
Core Theory Posts
What Is the Phillips Curve Really? - IB Economics Definition
Understanding the difference between short-run and long-run Phillips curves, including the fundamental unemployment-inflation trade-off.
Phillips curve definition | Unemployment inflation trade-off | Economic relationships | Policy menu | Original Phillips relationship | Short-run trade-offs
The Trade-Off Explained - Unemployment vs Inflation
Breaking down why lower unemployment typically leads to higher inflation and the economic mechanisms behind this relationship.
Unemployment inflation trade-off | Economic trade-offs | Policy choices | Inverse relationship | Demand-pull inflation | Labour market pressure
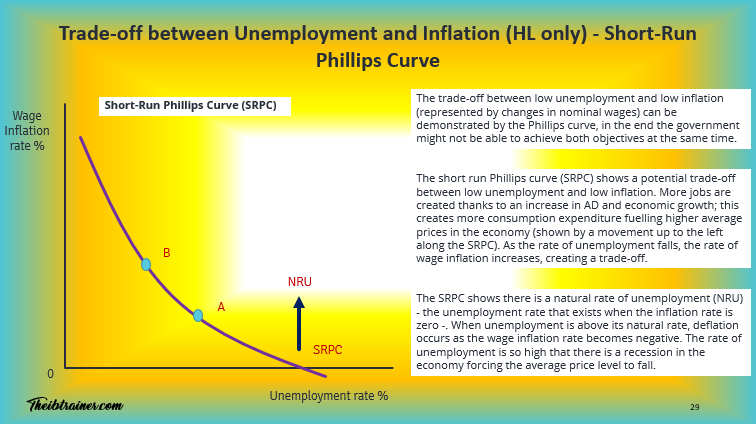
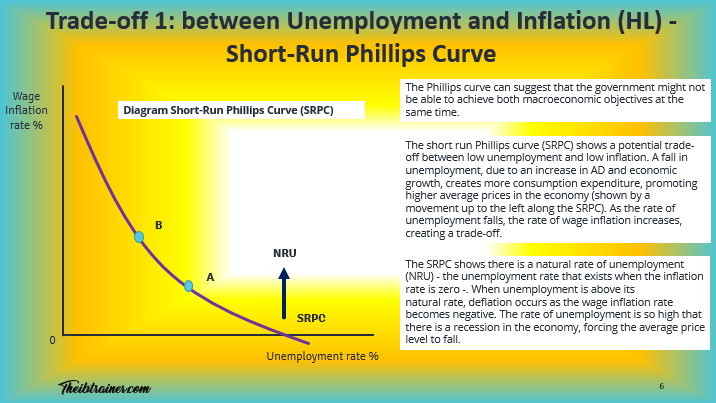
Short-Run Phillips Curve - Temporary Trade-Offs
How the SRPC shows the immediate relationship between unemployment and inflation changes in the economy.
Short-run Phillips curve | SRPC analysis | Temporary trade-offs | Movement along curve | Demand management | Fiscal monetary policy
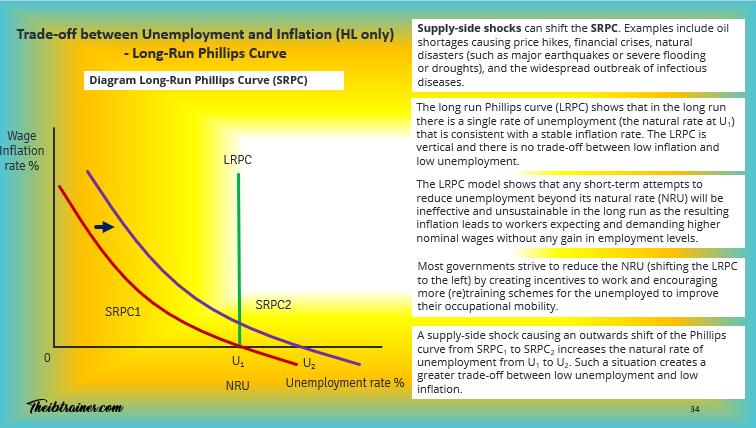
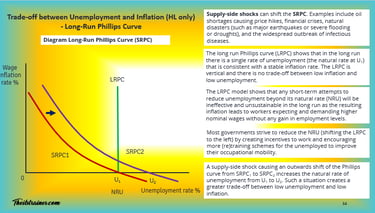
Long-Run Phillips Curve - No Trade-Off
Understanding why the LRPC is vertical at the natural rate of unemployment and what this means for long-term policy.
Long-run Phillips curve | LRPC vertical | Natural rate unemployment | NAIRU concept | No long-term trade-off | Expectations adjustment
Natural Rate of Unemployment - NAIRU Explained
The Non-Accelerating Inflation Rate of Unemployment and its critical role in Phillips Curve analysis.
NAIRU definition | Natural unemployment rate | Full employment | Structural unemployment | Frictional unemployment | Inflation stability
Phillips Curve Components
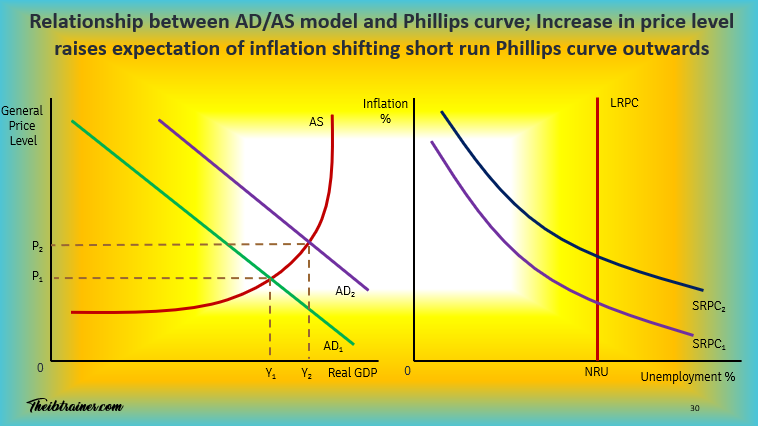
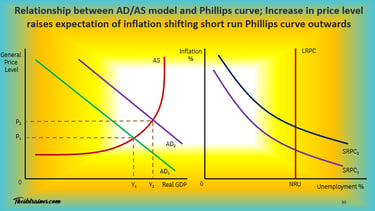
Expectations-Augmented Phillips Curve - Modern Analysis
How inflation expectations modify the basic Phillips relationship and create shifts in the curve.
Expectations augmented | Inflation expectations | Curve shifts | Adaptive expectations | Rational expectations | Policy credibility
Supply Shocks and Phillips Curve - External Disruptions
How oil crises, pandemic disruptions, and other supply shocks affect the unemployment-inflation relationship.
Supply shocks | Oil crises | External shocks | Curve shifts | Cost-push inflation | Economic disruptions
Monetary Policy and Phillips Curve - Central Bank Tools
How central banks use Phillips Curve analysis in setting interest rates and managing economic stability.
Monetary policy tools | Central bank strategy | Interest rate policy | Inflation targeting | Policy transmission
Phillips Curve Slopes - Steep vs Flat
Understanding what determines the slope of the Phillips Curve and what this means for policy effectiveness.
Phillips curve slope | Steep vs flat curves | Policy effectiveness | Wage flexibility | Economic structure | Response sensitivity
Real-World Applications & Case Studies For Your IB Economics Course
Current Global Examples (2024-2025)
UK Phillips Curve - Recent Performance
Britain's unemployment rate of 4.3% in October 2024 alongside inflation of 2.6% in November 2024 demonstrates modern Phillips Curve dynamics.
UK unemployment inflation | Phillips curve UK | Current economic data | Bank of England policy | British labour market | Inflation targeting
US Phillips Curve Flattening - Federal Reserve Challenge
How the relationship between unemployment and inflation has weakened, with Fed Chair Powell noting it's now "a faint heartbeat" compared to historical patterns.
US Phillips curve | Fed policy challenges | Curve flattening | Powell statements | Modern monetary policy | Inflation expectations anchored
European Phillips Curve - ECB Analysis
How European Central Bank policy demonstrates Phillips Curve thinking across different member economies with varying unemployment rates.
European Phillips curve | ECB policy | Eurozone unemployment | Inflation targeting | Multiple economies | Monetary union challenges
Post-Pandemic Phillips Curve - Supply Chain Disruptions
How COVID-19 and supply chain issues created new challenges for traditional Phillips Curve analysis.
Post-pandemic economics | Supply chain inflation | COVID economic impact | Modern supply shocks | Global disruptions | Policy responses
Historical Breaking Points
1970s Stagflation - Phillips Curve Breakdown
The period when the United States experienced high unemployment and high inflation simultaneously between 1973-1975, directly contradicting Phillips Curve predictions.
1970s stagflation | Phillips curve breakdown | Oil crisis impact | Economic theory crisis | Policy failure | Keynesian challenge
OPEC Oil Crisis - Supply Shock Impact
How OPEC's 1973 oil embargo quadrupled oil prices and created the supply shock that broke the Phillips relationship.
OPEC oil crisis | 1973 embargo | Supply shock economics | Energy price inflation | Cost-push inflation | International economics
Volcker Recession - Breaking Inflation Expectations
How Fed Chairman Paul Volcker's dramatic interest rate increases to 21% in 1981 restored Phillips Curve credibility.
Volcker recession | Fed credibility | Interest rate shock | Inflation expectations | Monetary policy success | Economic sacrifice
Germany Hyperinflation vs UK Stability - Contrasting Cases
Comparing different historical experiences with inflation and unemployment relationships across major economies.
International comparisons | Hyperinflation cases | Monetary policy differences | Economic structure impact | Historical examples | Cross-country analysis
Economic Systems and Phillips Curve In IB Economics
Market Economy Responses
Central Bank Independence - Credibility and Expectations
How independent central banks use Phillips Curve analysis while maintaining credibility to anchor inflation expectations.
Central bank independence | Policy credibility | Inflation expectations | Monetary authority | Economic institutions | Policy frameworks
Flexible Exchange Rates - International Phillips Effects
How flexible exchange rates affect the Phillips Curve relationship through import prices and competitiveness.
Exchange rate policy | International trade effects | Import price inflation | Competitive devaluation | Open economy Phillips | Global integration
Labour Market Flexibility - Phillips Curve Slopes
How different degrees of labour market regulation affect the steepness of the Phillips Curve relationship.
Labour market flexibility | Wage bargaining | Employment protection | Phillips curve slope | Structural reforms | Market institutions
Command Economy Alternatives
Soviet Planning - No Phillips Trade-Off
How centrally planned economies avoided Phillips Curve trade-offs through direct price and wage controls.
Central planning | Price controls | Command economies | Soviet system | No market trade-offs | State allocation
Price Control Systems - Suppressed Inflation
Historical examples of economies using price controls to avoid Phillips Curve trade-offs and their consequences.
Price controls | Suppressed inflation | Queue economics | Shortages | Black markets | Control system failure
Modern China - Managed Phillips Relationship
How China's mixed economy manages unemployment and inflation through state intervention and market mechanisms.
Chinese economic model | State intervention | Mixed economy | Managed trade-offs | Development strategy | Inflation control
Cross-Topic Connections For Your IB Economics Course
Phillips Curve and Development
Developing Economy Phillips Curves - Different Patterns
How the unemployment-inflation relationship differs in developing economies with large informal sectors.
Development economics | Informal sector | Dual economy | Development inflation | Structural unemployment | Growth patterns
Inflation and Growth - Development Trade-Offs
The relationship between moderate inflation, economic growth, and development in emerging economies.
Development inflation | Growth relationships | Moderate inflation | Investment incentives | Development finance | Capital formation
Phillips Curve and Inequality - Distributional Effects
How unemployment and inflation affect different income groups differently in the development process.
Income distribution | Inflation impact | Unemployment effects | Development inequality | Social costs | Policy targeting
International Economics
Open Economy Phillips Curve - Exchange Rate Effects
How international trade and capital flows modify the basic Phillips Curve relationship.
Open economy | Exchange rates | Trade effects | Capital flows | International transmission | Global integration
Phillips Curve Coordination - International Policy
How countries coordinate monetary policies considering Phillips Curve effects in a globalised world.
Policy coordination | International cooperation | Spillover effects | Global monetary policy | Central bank coordination | Economic integration
Import Price Phillips Effects - Global Supply Chains
How global supply chains and import prices create new dimensions to the Phillips Curve relationship.
Global supply chains | Import prices | Supply chain inflation | International production | Trade dependencies | Global integration
Current Statistics & Data (2024-2025) You Can Use In Your IB Economics Course
Key Global Phillips Indicators
UK Unemployment: 4.3% (October 2024), UK Inflation: 2.6% (November 2024)
US Unemployment: Around 4% with inflation near 2% target
Eurozone: Varied unemployment rates across member states
Japan: Ultra-low unemployment with persistent low inflation challenge
Global Pattern: Flattening Phillips relationships across developed economies
UK-Specific Phillips Data
Regional Variation: Wales 5.3%, England 4.4%, Scotland 3.3%, Northern Ireland 2.0% unemployment rates
Inflation Peak: 11.1% in October 2022 during cost-of-living crisis
Bank of England Policy: Inflation targeting at 2% affecting Phillips trade-offs
Brexit Impact: Labour shortages affecting wage-price dynamics
Energy Crisis: Supply shocks challenging traditional Phillips relationships
Regional Performance
Advanced Economy Phillips Patterns - Developed Country Trends
Flattening Phillips Curves across US, UK, Europe, and Japan due to anchored expectations.
Advanced economies | Developed countries | Anchored expectations | Central bank credibility | Low inflation era | Policy effectiveness
Emerging Market Phillips Volatility - Development Challenges
More volatile unemployment-inflation relationships in emerging economies due to structural factors.
Emerging markets | Development challenges | Economic volatility | Structural factors | External shocks | Policy constraints
Post-Communist Transition - Phillips Transformation
How former communist economies experienced unique Phillips Curve patterns during market transitions.
Transition economies | Market reform | Institutional change | Economic transformation | Policy challenges | Structural adjustment
IB Economics Course Exam Excellence
Question Techniques
Evaluating Phillips Curve Policies - Paper 3 Framework
Framework for analysing whether governments should exploit Phillips Curve trade-offs in extended response questions.
IB Economics evaluation | Phillips policy analysis | Paper 3 techniques | Economic evaluation framework | Policy assessment | Trade-off evaluation
Phillips Curve Diagrams Made Simple - Visual Analysis
Short-run and long-run Phillips curves, shifts, and movements for clear visual representation of concepts.
Phillips curve diagrams | SRPC LRPC | Economic graphs | Visual analysis | Diagram techniques | Curve movements shifts
Linking Phillips to Other Topics - Higher Level Analysis
Connecting Phillips analysis to aggregate demand / aggregate supply, monetary policy, international economics, and development.
Phillips cross-topic links | Economic connections | Topic integration IB | Higher level analysis | Economic relationships | Synthesis skills
Expectations vs Reality - Critical Analysis
Distinguishing between theoretical Phillips relationships and real-world complexities for analytical purposes.
Theory vs reality | Phillips limitations | Critical evaluation | Real-world complexity | Policy constraints | Economic realism
IB Economics Real Exam Questions
Past Paper Analysis: Phillips Questions - High-Scoring Responses
Breaking down successful responses to Phillips Curve questions with examiner insights and common mistakes.
IB Economics past papers | Phillips exam questions | High scoring answers | Examiner reports | Phillips question analysis | Exam success strategies
Phillips Essay Planning - 15-Mark Structure
Planning and structuring long-form evaluation questions on Phillips Curve and monetary policy topics.
Phillips essay structure | 15 mark questions | Essay planning IB | Phillips evaluation essay | Long form responses | Essay technique
Case Study Analysis - Phillips Examples
Using real-world Phillips Curve examples effectively in exam responses with supporting economic data.
Phillips case studies | Real examples IB | Country examples | Phillips evidence | Case study technique | Practical applications
Data Response Techniques - Phillips Statistics
Interpreting and analysing unemployment and inflation data in Paper 1 data response questions.
Phillips data response | Statistical analysis | Data interpretation | Economic data | Quantitative analysis | Paper 1 techniques
Emerging Issues & Future Trends
Digital Age Phillips Curve
Gig Economy and Phillips Curve - New Employment Patterns
How the rise of gig work and flexible employment affects traditional unemployment measures and Phillips relationships.
Gig economy | Flexible employment | Modern labour markets | Employment classification | New work patterns | Phillips measurement
Automation and Phillips Curve - Technology Impact
How artificial intelligence and automation affect the unemployment-inflation trade-off relationship.
Automation impact | AI employment | Technology unemployment | Future labour markets | Structural change | Phillips evolution
Remote Work Phillips Effects - Post-Pandemic Changes
How widespread remote work adoption affects regional labour markets and Phillips Curve relationships.
Remote work | Geographic flexibility | Regional labour markets | Post-pandemic economics | Location independence | Market integration
Climate and Phillips Curve
Green Transition Phillips Effects - Environmental Policy
How climate policies and green transitions affect unemployment and inflation through economic restructuring.
Green transition | Climate policy | Environmental economics | Structural adjustment | Energy transition | Sustainable development
Carbon Price Phillips Impact - Environmental Costs
How carbon pricing and environmental regulations create new inflationary pressures affecting Phillips relationships.
Carbon pricing | Environmental costs | Green inflation | Climate policy | Sustainability costs | Policy integration
Climate Shocks and Phillips Curve - Weather Disruptions
How climate change creates new supply shocks affecting traditional Phillips Curve analysis.
Climate change | Weather shocks | Environmental disruption | Supply shock | Economic adaptation | Climate economics
Future Policy Challenges
Digital Currency Phillips Effects - Central Bank Innovation
How central bank digital currencies might affect monetary policy transmission and Phillips relationships.
Digital currency | CBDC policy | Monetary innovation | Policy transmission | Central bank tools | Financial technology
Ageing Population Phillips Impact - Demographic Change
How demographic transitions affect labour markets and the unemployment-inflation relationship.
Ageing population | Demographic transition | Labour force | Pension costs | Economic structure | Social policy
Global Integration vs Phillips Sovereignty - Policy Constraints
How global economic integration constrains national Phillips Curve policy options.
Global integration | Policy sovereignty | International constraints | Economic interdependence | Policy effectiveness | Coordination challenges
Essential Phillips Curve Diagrams
Why This Hub Matters for Your IB Economics Course Success
Understanding the Phillips Curve isn't just about memorising the inverse relationship - it's about recognising how this fundamental economic relationship shapes monetary policy decisions, challenges economic theory, and affects millions of lives through unemployment and inflation outcomes. Every post in this hub connects to your broader IB Economics understanding, whether you're analysing aggregate demand and aggregate supply, evaluating central bank policies, or discussing international economic coordination.
For Maximum IB Economics Exam Success:
Use real Phillips Curve examples from this hub in your IB Economics essays
Connect Phillips analysis to other topics like monetary policy, international trade, and development economics
Practice diagrams using the visual techniques covered
Develop balanced evaluation skills using the frameworks provided
Ready to Master the Phillips Curve? Start with the fundamental theory posts, then explore the real-world case studies that interest you most. Each post builds your understanding while giving you concrete examples for your IB Economics course exam success.
This hub is regularly updated with the latest statistics, policy changes, and exam requirements. Bookmark this page and return regularly as you progress through your IB Economics course.
For access to all IB Economics exam practice questions, model answers, IB Economics complete diagrams together with full explanations, and detailed assessment criteria, explore the Complete IB Economics Course:
Internal Assessment (IA) Guide – Free Download
Step-by-step support on topic selection, structure, evaluation, and most common IB Economics IA mistakes.
Understanding key IB Economics Internal Assessment concepts
Applying and explaining them in real-world IB Economics contexts
Building IB Economics IA confidence without drowning in dry theory and explanations.
Download the IA guide now for free and boost your IB Economics grades and confidence:
IB Economics Diagrams What's included?
200+ exam-ready diagrams covering the entire IB Economics syllabus and some more
Video work showing you exactly each model with explanations
Image-ready versions perfect for answering essays, presentations, and your IA
Detailed written explanations of the economic theory next to each diagram
Both SL and HL diagrams clearly labelled and organised by module and unit
Real exam application showing how to use diagrams effectively in Paper 1 and Paper 2


© Theibtrainer.com 2012-2026. All rights reserved.
More Basic Resources For IB Students:
Legal
Have a Tip? Send us a tip using our anonymous form