
IB Economics Unemployment Uncovered
IB Econ students! Get the lowdown on unemployment: types, measurement woes & real-world examples (UK/global). Ace your exams! #IBEconomics #Unemployment
IB ECONOMICS HLIB ECONOMICS SLIB ECONOMICS MACROECONOMICSIB ECONOMICS
Lawrence Robert
4/24/20258 min read


Unemployment Uncovered: More Than Just Numbers
Today let's cover something that has probably been on your minds at least once, even if it was just lurking in the background: jobs. Getting one, keeping one, and what happens when folks can't find one. We're talking Employment and its grumpy cousin, Unemployment.
You might think employment is just... having a job. Technically, in Econ-speak, it’s using factors of production (specifically labour - that's you lot, eventually!) to produce stuff. Simple enough. Governments love high employment. It's right up there with economic growth on their macroeconomic objective list. Why? Happy employed people spend money, pay taxes, and generally don't need as much support. It’s a win-win.
IB Economics What Exactly Is Unemployment?
Officially, unemployment is when someone is willing and able to work, is actively looking for a job, but can't find one. It's a sign the labour market (where jobs are demanded by firms and supplied by workers) is out of whack - a classic market disequilibrium. And it's inefficient - like having a Ferrari in the garage but no petrol; the economy isn't reaching its potential output.
Internal Assessment (IA) Guide – Free Download
Step-by-step support on topic selection, structure, evaluation, and most common IB Economics IA mistakes.
Understanding key IB Economics Internal Assessment concepts
Applying and explaining them in real-world IB Economics contexts
Building IB Economics IA confidence without drowning in dry theory and explanations.
Download the IA guide now for free and boost your IB Economics grades and confidence:
Why Do Governments Sweat About Low Unemployment?
Economic Growth: More jobs mean more income, meaning more spending (higher Aggregate Demand!), which fuels economic growth. They go together like tea and biscuits.
Happy People: Having a job generally boosts well-being and living standards. Less stress about bills = happier citizens.
Ker-ching for the Treasury: Employed folks pay income tax. They also buy more stuff, generating VAT (indirect taxes). This cash funds schools, hospitals (hello NHS!), roads - all the good stuff. Think of the tax revenue generated from workers at major employers like Tesco or British Airways.
Less Strain on the Public Purse: Fewer people unemployed means the government shells out less on benefits (like Universal Credit in the UK).
Stopping the Brain Drain: If skilled workers can't find decent jobs, they might emigrate. Imagine all the clever doctors, engineers, or tech whizzes heading overseas - that's a loss for the UK economy! We saw concerns about this post-Brexit in specific sectors.
Measuring the Misery: The Unemployment Rate
Okay, let's get technical, but keep it simple. The Unemployment Rate is the headline figure you see in the news.
The Formula: Unemployment Rate = Labour Force / Number of Unemployed People×100
Who counts as "Unemployed"? Remember: willing, able, actively seeking work.
What's the "Labour Force"? This is crucial! It's everyone employed PLUS everyone unemployed (as defined above). It's not the whole population. Kids, full-time students (like most of you!), prisoners, and people who choose not to work (e.g., stay-at-home parents, early retirees) aren't considered the labour force.
Quick Example: Imagine the UK labour force is roughly 35 million people (it's around that ballpark). If 1.5 million are officially unemployed, the unemployment rate is:
35,000,000 / 1,500,000×100 ≈4.3% (Note: Check the latest ONS stats for the actual current UK figure! It fluctuates.)
IB Economics Difficulties in Measuring Unemployment (AO4)
Getting an accurate unemployment figure is trickier than ending the IB Course with a grade 7 in Physics, Maths and Chemistry HL!
No Universal Definition: The age you can start work or retire differs globally (e.g., 60 in Russia vs. 65+ in parts of Europe).
Hidden Unemployment: These folks aren't counted as unemployed but probably would work if they could.
Discouraged Workers: People who've given up looking after countless rejections. Your uncle who got laid off from the factory, looked for months, got disheartened, and now just does odd jobs for cash? He might be hidden unemployed.
Early Retirees (Involuntary): Sometimes older workers are pressured out and take early retirement, but might have preferred to work.
Underemployment: This is a big one, especially with the rise of the "gig economy". It's people working, but not as much as they want or need, or in jobs below their skill level.
IB Economics Real-life Example: Think of Sarah, a qualified graphic designer driving for Uber because she can't find a full-time design role. She's employed, but underemployed. Is the official low unemployment rate telling her story? Probably not. This includes involuntary part-time workers who desperately want full-time hours.
Voluntary Unemployment: People choosing not to work aren't counted. That's fair enough, but it means the unemployment rate isn't capturing everyone without a job.
Stats Averages Hide Differences: The national rate (e.g., that 4.3% we calculated) smooths over massive variations. Youth unemployment is often much higher (check stats for Spain or Greece for stark examples). Unemployment might be higher in the North East of England than the South East, or differ significantly between ethnic groups (again, ONS data often shows disparities in the UK). These nuances are vital for accurate evaluation!
Why Are People Unemployed? The Different Reasons (AO2 / AO4)
Unemployment isn't just one thing. Economists love to categorise:
Cyclical Unemployment (Demand Deficient): The big one. This follows the business cycle. When the economy hits a recession (negative growth), firms see falling demand, cut back production, and lay people off. It's widespread and nasty.
IB Economics Real-life Example: Remember the 2008 Financial Crisis? Or the massive hit to hospitality and travel during the COVID-19 lockdowns (early 2020s)? Loads of businesses shut or scaled back, causing huge spikes in cyclical unemployment globally. Airlines like EasyJet or IAG (British Airways owner) had massive struggles. It's unemployment caused by a general lack of demand in the economy (AD shifting left!).
Structural Unemployment: This is long-term and painful, caused by changes in the structure of the economy. An industry declines, or technology makes skills obsolete.
IB Economics Real-life Example: Think of coal miners in the UK decades ago, or steel workers in the US Rust Belt area. The industry shrank, and their skills weren't easily transferable. More recently? Automation in warehouses (think Amazon robots) replacing manual pickers, or potentially AI impacting certain white-collar jobs. There's a mismatch between the skills workers have and the skills employers need. This often requires retraining workers (government schemes sometimes try to help here).
IB Economics Real-life Example: The decline of traditional high-street retail due to online shopping (like Amazon) has caused structural unemployment among retail workers whose skills weren't directly transferable to, say, logistics or digital marketing.
Seasonal Unemployment: Predictable job losses at certain times of the year.
The Anecdote: Your mate who works at the seaside ice cream shop? Probably not working there in January. Ski instructors in the Alps during summer? Plenty of time for hiking. Farm workers after harvest season? Same deal. It mainly affects specific industries.
Frictional Unemployment: Short-term unemployment as people move between jobs. It takes time to find the right job, apply, interview, etc.
IB Economics Real-life Example: You finish your A-Levels / IB, quit your part-time café job, and spend a few weeks searching for an apprenticeship or a better role before starting. That gap? Frictional unemployment. It's generally seen as unavoidable and even healthy in a dynamic economy where people can switch to better jobs. Better information (online job boards like Indeed or LinkedIn) can reduce it, but it always exists.
For access to all IB Economics exam practice questions, model answers, IB Economics complete diagrams together with full explanations, and detailed assessment criteria, explore the Complete IB Economics Course:
Wages and Unemployment in your IB Economics Course
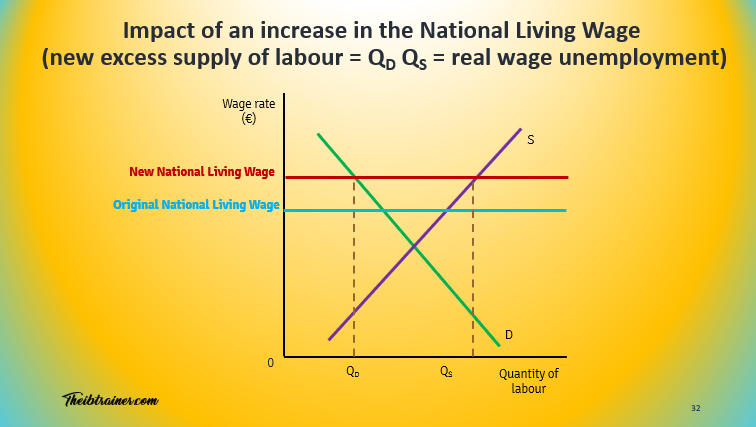
Real Wage Unemployment: Sometimes, wages are forced above the market equilibrium (where supply equals demand). The classic example is a National Minimum Wage (NMW) set too high.
(Imagine a graph here: Demand for Labour slopes down, Supply slopes up. Equilibrium is where they cross - WE*, QE). If the government forces a minimum wage (WM) above WE, firms demand less labour (QD falls) because it's more expensive, but more people want to work (QS rises) because the wage is higher. The gap between QS and QD is unemployment caused by the wage being artificially high. Firms willing to pay more than WM get an employer surplus (Area A); workers willing to work for less but getting WM get employee surplus (B+C). But there's a welfare loss (D+E) because fewer people are employed than at equilibrium.*
Real-World Debate: This is HUGELY debated. Does the UK's NMW (National Minimum Wage) cause significant unemployment? Evidence is mixed. Supporters say it boosts incomes for the low-paid with minimal job losses (firms might absorb costs or raise prices slightly). Critics argue the minimum wage does hurt employment, especially for younger, less skilled workers or small businesses. Recent large increases in the NMW / National Living Wage in the UK (check current rates!) keep this debate alive.
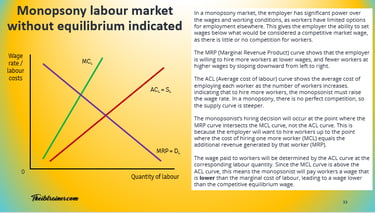
Monopsony Power: What if there's basically only one major employer for a certain type of labour in an area? Think the NHS for specialist nurses in some regions, or maybe a huge car factory in a small town. This employer (a monopsonist) has market power. They know workers don't have many alternatives.
(Imagine this on a graph): The monopsonist faces an upward-sloping supply curve of labour (the ACL curve - Average Cost of Labour). To hire more people, they must pay everyone a higher wage, so the cost of hiring one more worker (the Marginal Cost of Labour - MCL) rises even faster and is above the ACL curve. They hire where the benefit of the last worker (their Marginal Revenue Product - MRP) equals the cost of that last worker (MCL). BUT, they only have to pay the wage shown on the ACL curve for that quantity – which is lower than the MCL and often lower than a competitive wage would be.
The Upshot: Monopsony power can lead to lower wages and potentially lower employment than in a competitive market. It's about the employer having too much bargaining power.
Every episode of Pint-Sized links back to what matters most for your IB Economics course:
Understanding key IB Economics concepts
Applying them in real-world IB Economics contexts
Building IB Economics course confidence without drowning in dry theory.
Subscribe for free to exclusive episodes designed to boost your IB Economics grades and confidence:
The Big Picture for Your IB Economics Exams
Understanding unemployment isn't just about definitions. It's about:
Application (AO2): Using real examples (UK, global, specific industries / companies) to illustrate the types and causes. Calculating the rate. Explaining the graphs.
Evaluation (AO4): Critiquing the stats (measurement difficulties!), discussing the pros and cons of policies like the minimum wage, comparing the severity of different types of unemployment (cyclical vs. frictional), considering the impact on different groups.
IB Economics Diagrams Programme, What's included:
200+ exam-ready diagrams covering the entire IB Economics syllabus
Video for every diagram showing you exactly how each model looks
Image version perfect for modelling diagrams in you essays, presentations, and your IA
Detailed written explanations of the IB Economics theory behind each diagram
Both SL and HL IB Economics diagrams clearly labelled and organised by topic
Real IB Economics exam application showing how to use diagrams effectively in Paper 1 and Paper 2
This stuff matters. It affects people's lives profoundly and shapes government policy. Understanding the nuances will really help you shine in your IB Economics exams. And maybe, make sense of those dodgy news headlines!
Stay well


© Theibtrainer.com 2012-2026. All rights reserved.
More Basic Resources For IB Students:
Legal
Have a Tip? Send us a tip using our anonymous form